Veronica wrote: Sat Jan 25, 2020 6:52 am
I recall reading that the sun has an 11 year cycle in respects to its solar flare activity. The idea expressed was that solar flare years indicated an increase and abundance.
I hadn't heard they were signs of increase and abundance. The studies I've read in the past showed them as times of instability and stress - more wars, market instability, higher crime rates, basically an
agitating effect - matching their physical effect on, say, disrupting radio signals and other communication / broadcast paths and destabilizing Earth's weather patterns.
But very low solar flare periods can also have these things - we are currently closer to the
minimum point in the 11-year cycle (2019 was the minimum of the present cycle).
Was curious about this idea in respect to SSRs. If the years SSR occurs during an active year of flares are those years distinctive for the individual? Do we as humans have any showing in our lives of this pattern?
I don't know. I don't think the matter has ever been studied, and I encourage anyone to do so. What would you mean by "distinctive to the individual," though? Everyone in the world would have a solar return in the most-active year so it wouldn't distinguish one person from another. If there is anything to this idea, what (concrete and measuredly) would it be? Perhaps that astrological effects in general were intensified?
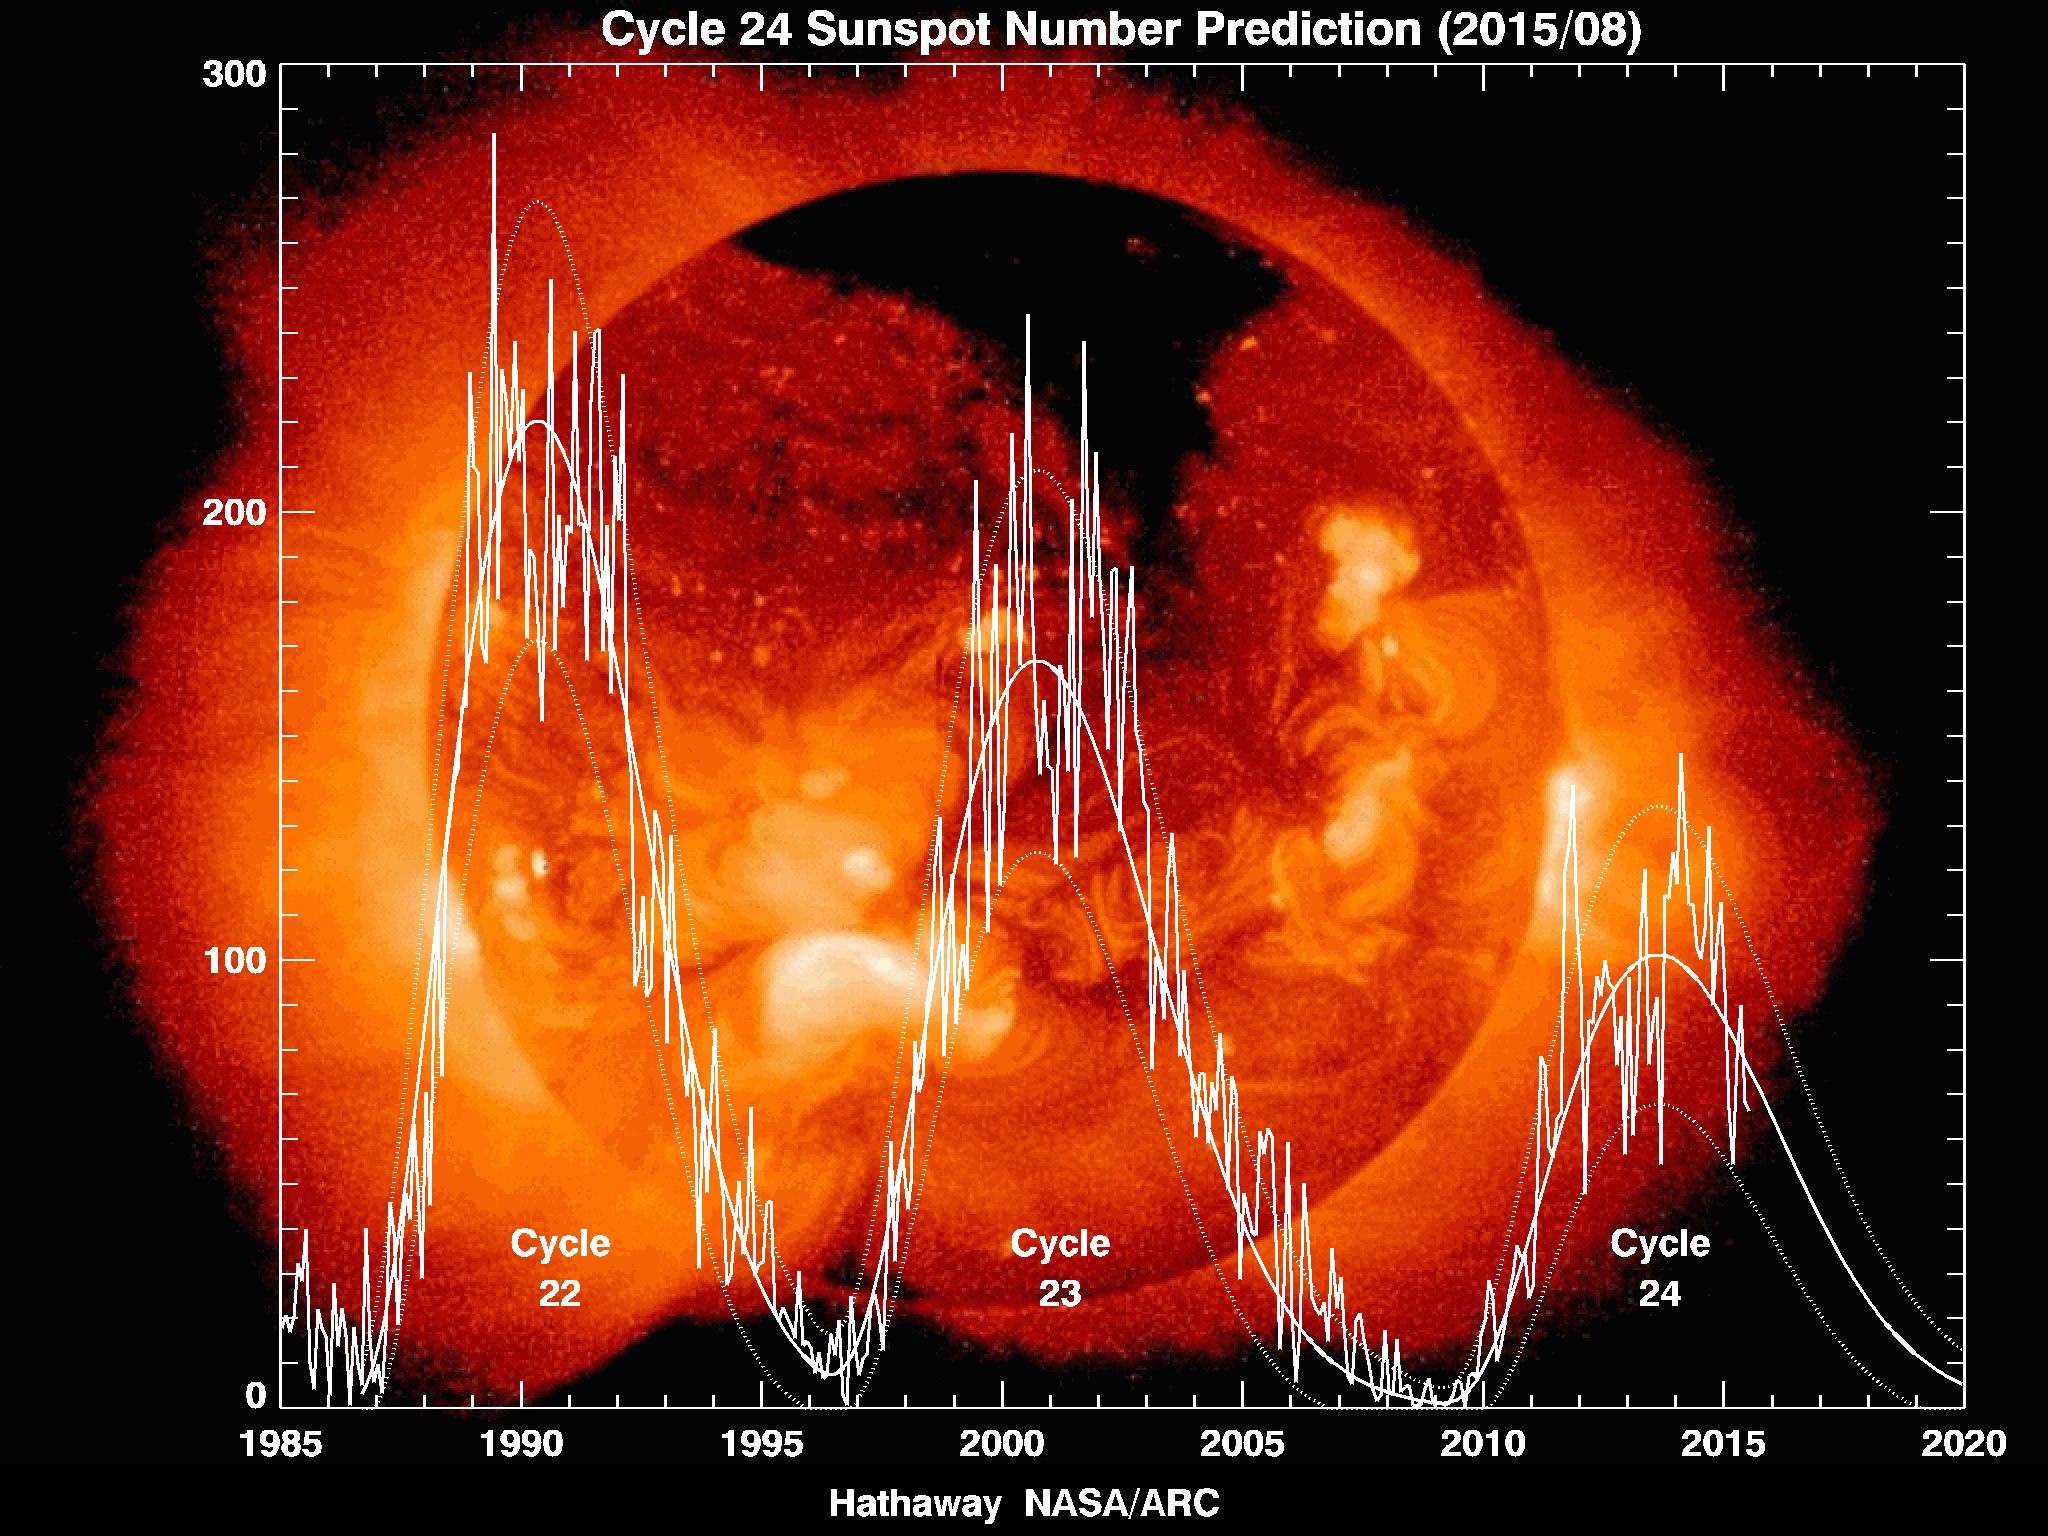
The last sunspot maximum was in 2014, a slow build and it came later (it was expected in 2011). It wasn't a very strong maximum, so the last really strong one was in 2000. (This is really a 22-year cycle with lesser and greater peaks and troughs twice during that time, hence the appearance it's 11 years long.) If the 11-year
average is followed, we'll next have one around 2025.
This beautiful graphic might be helpful.

